for my heirs & descendents
Using Sell Indicators
-
Pivot Highs ( Close / 5 day/ 15 day)
-
Cross Downs ( Close / 5 day/ 15 day)
-
RSI Over Bought >90
-
Double Top
-
​
-
Stop Loss
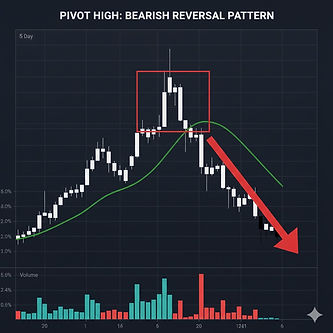
Reversal Pivot Highs
The 3-Bar Pivot High (close / 5 day / 15 day):
-
Left Bar: Has a lower high than the center bar.
-
Center Bar (The Pivot): Has the highest high of the group.
-
Right Bar: Has a lower high than the center bar.
Traders often use a "strength" or "period" setting to make this more significant. For example, a 5-bar Pivot High requires two lower highs to the left and two lower highs to the right. The more bars required on either side, the more significant the reversal point is considered

Price Closes below 5 day Moving Average
In technical analysis, a Close Price crossing below a 5-day Moving Average (MA) is a short-term bearish signal indicating that the current price has lost its immediate upward momentum. Because the 5-day period is short, this signal is highly sensitive. Price crossing below 5 day MA is often the first warning sign that a short-term rally may be stalling.

RSI Over Bought
The RSI Over Bought indicator has moved above 90 on 19 Dec. The only way from here is down e.g. Dec 24.
-
Pivot Highs ( Close / 5 day/ 15 day)
-
Cross Downs ( Close / 5 day/ 15 day)
-
RSI Over Bought >90
-
Double Top
-
​
-
Stop Loss

A trader who bought APX on 18 Dec or early on 19 Dec (Commsec provides intra day stock prices in chart form) would have made about 9% in 5 days.

The Doji (open and close very close together) on 23 Dec is a possible sell indicator as well, also flagging a potential change in direction.
Having made about 9% in 5 days the Swing Trader must be ready to take profits.
As the saying goes "You can't go broke taking a profit!".
Monitoring Sell indicators is essential.
For the risks involved in Swing Trading ask Google Gemini AI
Double Top
At the end of September there is a clear double top signifying the upcoming large fall in the Technology stock Index which is confirmed by the 5 and 15 day MA cross downs in early October.
-
Pivot Highs ( Close / 5 day/ 15 day)
-
Cross Downs ( Close / 5 day/ 15 day)
-
RSI Over Bought >90
-
Double Top
-
​
-
Stop Loss

Market Crashes
The most important time to sell is when a market is about to crash (Chart: Advisor Perspectives) Note the prolonged falls lasting between ten and twenty years followed rises in the inflation-adjusted S&p 500 share index.
​​​​
- World War 1 contraction 1920-1
- The Great Depression 1929-31
- ​Recession of 1937-8
- ​Vietnam War & Gold Crisis 1970
- First Lost Decade 1968-1982
- Second Lost Decade 2000-2009
- Global Financial Crisis 2008
- Corona Virus Pandemic 2020
- Trump's Tariffs 2025
- ​

Post World War 1 Contraction 1920-1
While the post-World War I era is often associated with the "Roaring Twenties," it actually began with a sharp and painful economic contraction known as the Recession of 1920–1921. This period saw the Dow Jones Industrial Average drop by nearly 47% from its 1919 peak. The contraction was caused by a "perfect storm" of demobilization, aggressive monetary policy, and global agricultural shifts.
The Great Depression 1929-31
Over the two-day period of Black Monday and Black Tuesday in October 1929, the Dow lost a combined total of approximately 23% of its value. This rapid and massive destruction of wealth, estimated at over $30 billion across those two days, severely undermined consumer and investor confidence, which contributed significantly to the onset of the Great Depression.
The stock market would not regain its pre-crash peak of 381.17 points, reached on September 3, 1929, for another 25 years, until November 1954.
-
World War 1 contraction 1920-1
-
The Great Depression 1929-31
-
​Recession of 1937-8
-
​Vietnam War & Gold Crisis 1970
-
First Lost Decade 1968-1982
-
Second Lost Decade 2000-2009
-
Global Financial Crisis 2008
-
Corona Virus Pandemic 2020
-
Trump's Tariffs 2025

Recession of 1937-8
The stock market fall of 1937, often called the "Recession within the Depression," was a sudden and severe reversal that saw industrial stock prices drop by over 40%. Unlike the 1929 crash, which was driven by speculative frenzy, the 1937 crash is widely attributed to "policy errors"—specifically, the government withdrawing economic support too early.
- World War 1 contraction 1920-1
- The Great Depression 1929-31
- ​Recession of 1937-8
- ​Vietnam War & Gold Crisis 1970
- First Lost Decade 1968-1982
- Second Lost Decade 2000-2009
- Global Financial Crisis 2008
- Corona Virus Pandemic 2020
- Trump's Tariffs 2025
- ​​
Vietnam War & Gold Crisis 1970
​The Vietnam War and the gold crisis of 1971 (often called the "Nixon Shock") acted as a "double whammy" that ended the post-WWII economic boom and ushered in a decade of stagflation—a toxic mix of stagnant growth and high inflation.
First Lost Decade 1968-1982
The period between 1968 and 1982 is often described as a "lost decade" for investors. While the stock market didn't just crash once and stay down, it entered a grueling 14-year cycle of "sideways" movement where every rally was met with a deeper decline.
-
​The primary culprit was stagflation—the toxic and unusual combination of stagnant economic growth and high inflation.
-
Energy shocks acted as a massive "tax" on the global economy.
-
Failed Monetary Policy ("Stop-Go" Policy)
-
Geopolitical and Social Turmoil
Second Lost Decade 2000-09
​The period from 2000 to 2009 is often referred to as the "Lost Decade" for the stock market. During this time, the S&P 500 actually provided a negative total return, meaning an investor who bought in at the start of 2000 had less money by the end of 2009.
-
The Dot-com Bubble Burst (2000–2002)
-
Geopolitical Shocks (2001–2003)
-
​The Great Recession & Global Financial Crisis (2007–2009)
- World War 1 contraction 1920-1
- The Great Depression 1929-31
- ​Recession of 1937-8
- ​Vietnam War & Gold Crisis 1970
- First Lost Decade 1968-1982
- Second Lost Decade 2000-2009
- Global Financial Crisis 2008
- Corona Virus Pandemic 2020
- Trump's Tariffs 2025
- ​​​
Global Financial Crisis 2008-9
​The 2008 Global Financial Crisis (GFC) triggered one of the most severe bear markets in history. Unlike previous crashes that were often contained within specific sectors. 2008 was a systemic collapse where the "plumbing" of the global financial system—the banks and credit markets—literally froze.
The effect on the stock market can be divided into three distinct phases:
1. The Slow Bleed (October 2007 – August 2008)
2. The Free fall (September 2008 – March 2009)
3. The Final Bottoming (March 9, 2009)
the destruction was historic.